
In line with the needs of the field, we can track target products following an IOT logic, make an inventory, and collect data using various manned or unmanned equipment. With the software prepared specifically for the field, the data is processed, and related parameters are found thanks to machine learning algorithms. Then they are uploaded into the system so that the company can make use of artificial intelligence tailored to their needs.
We have two main data collection methods. After the field exploration where the needs are identified, and the costs are calculated, one of these tools or all three as hybrids can be preferred, depending on the properties of the field.
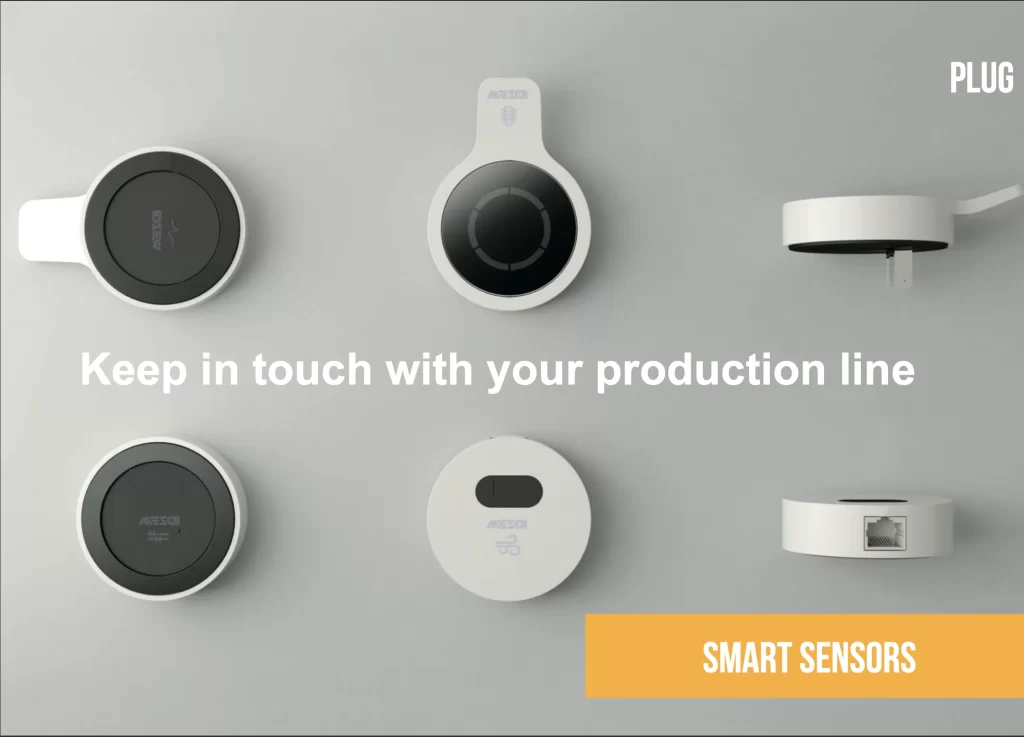
The first method is the collection of the data through Barcode & QR Code -Image Processing. The second method is the collection of the data with Video Recognition, known as ground-breaking face recognition technology. The last one is the collection of the data through RFID microchips and RFID antennas. In this method shaped according to the conditions of the field, it is decided on which tools will be used. We can offer a wide range of options as tools to our customers for data collection: tools planted at fixed points, forklifts, reach trucks and other logistics vehicles, hand-held terminals, rail system mechanisms, manual & autonomous robotic unmanned land vehicles, and manual & autonomous flying unmanned aerial vehicles are preferred.

Depending on the needs and features of the field, a customized software is prepared for the company. The key to the software is given to the company. The related software is designed in such a way that it will work on cloud and never interact with any existing databases or network structures in the facility.
The factory software and our software work separately. While the product information, code, barcode, production barcode is stored in the system of the company, a unique ID (UID) is defined for each palette or product in our system and the barcode information of the company is matched with UID in our data base. While all the data tracked in our system are stored with this UID, this information is seen as barcode information in the company’s system. Therefore, there is no need to change anything in the company’s database. In summary, we store the data collected during production or stocktaking at a certain time in a separate system and ensure that it works in the system of the company.

Productivity Analysis After Data Collection
Immediately after the collection of relevant data, productivity analysis has been performed. The more antennas are installed in the field, the better the location-based productivity analysis can be carried out. As a unique feature of the Taglette chips and antennas, it is possible to get location information with a 15 cm margin of error. Who moves to whose desk instantly can also be tracked, which can reveal which employee contributes how much to the production as productivity analysis. A year after the system is established, the average income from hidden inefficiency can reach 8%.
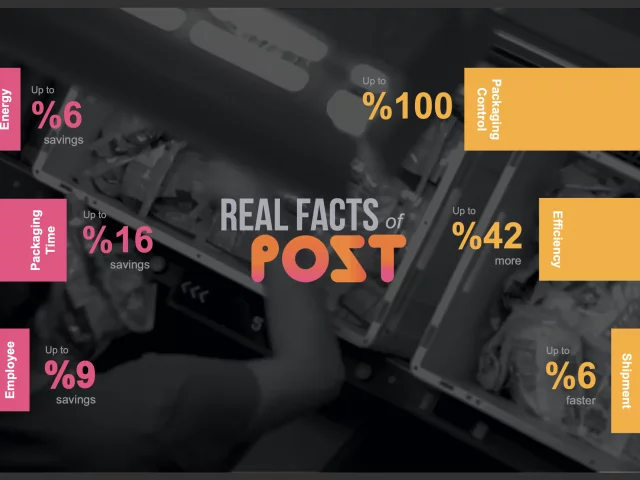
A significant amount of saving is made within a very short period of time from the total cost (staff, forklift, etc.) they have needed to do this job so far.
To date, only the finished products could be included in the productivity analysis. Now, with this technology, a detailed evaluation of who makes a mistake during production, warehousing and shipment and even how many stitching mistakes there are in textile-based production is possible.
An ERP system gives some information such as a “picking list” to a forklift operator as a pre-planned task list. Our software, however, gives this task list to the operator by analyzing the instant changes in the conditions coming from the field. Equipped with the data of the instant changes, the forklift operator is protected from field conflicts throughout the day and therefore hidden efficiency losses can be prevented.
The information regarding who takes which product where can be instantly obtained with the chips attached to the forklifts. Thanks to the forklift efficiency analysis performed immediately after the system starts to be used, forklift procurement, needs analysis and investment optimization are carried out. With the data obtained, the productivity analysis of the forklift operator and all other staff can be done. By assigning a user name to each forklift operator, it is easy to track which operator has loaded how many pallets, when the goods are taken and left, who has taken which goods. With this system, there is also no need for the forklift operator to scan the product with the hand-held terminal. Forklift work safety monitoring is carried out with instant surveillance of the users, and unplanned driving by unauthorized people are prevented.
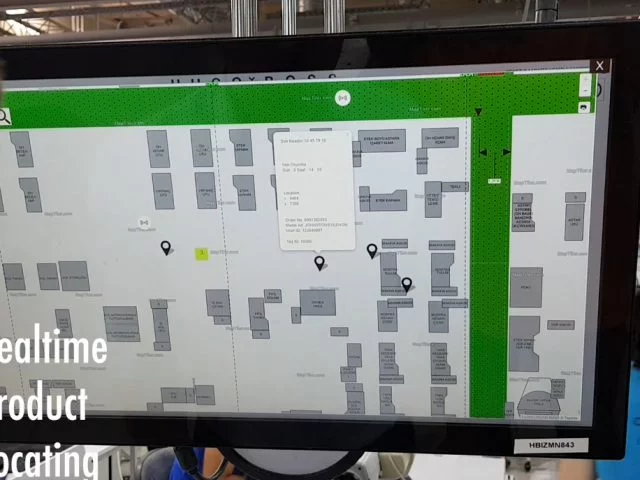
A tablet is also placed in the forklifts in which a chip is placed. The screen of this tablet used by the operator is divided in two. On one side of the divided screen is a list of what needs to be taken. It is possible to check each product after it is taken. On the other side of the screen is an “indoor navigation” map that will direct the forklift operator. The intelligent “picking list” planned with “indoor navigation” shows which product is where on the map. The information regarding in which order the products should be taken according to the location is sent to the tablet of the forklift operator with the “indoor navigation”. Thanks to the real time “Picking List” with “Indoor Navigation”, the firms which carry out random storing in their warehouses can plan which product is to be loaded on which truck when and the route the truck is to follow. Which loading plans are completed are monitored.
With “indoor navigation”, traffic problems such as a forklift trying to go in the same direction with another forklift can be eliminated. With a right “picking list”, faster and more efficient results are obtained. With this data coming from the software, it is possible to efficiently perform instant loading and planning. The software provides you with the opportunity to monitor the analysis such as how long it takes to load a truck or when the second truck should approach from a single screen.
If your operator makes a mistake and tries to load a wrong product, the system warns that the wrong product is being loaded through the forklift. The company can avoid wrong loading and all the extra costs incurred by it. If there is an instant changing system in the machine park, it is very difficult to spot a machine due to these instant changes. Identifying their location makes it possible to follow the performance and failures of the machines.
In a day, an incredibly large data flow takes place. Within 1 day, only logs can
exceed 1 GB size. It is a must to analyze these collected data in a healthy manner.
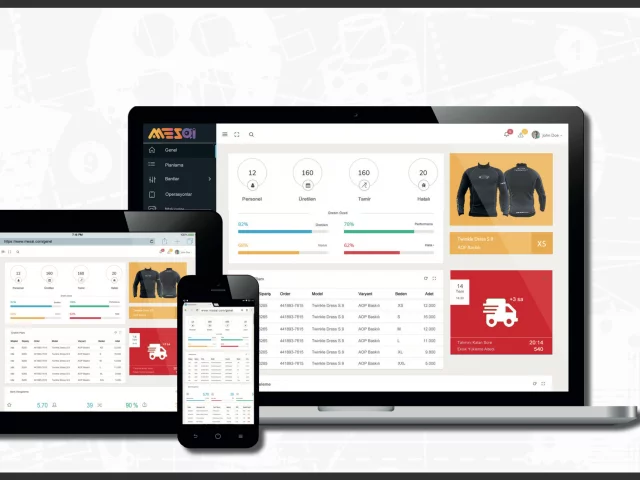
Here, we carry out the analysis instantaneously, not in a “Data comes first; then we analyze it.” manner. The blue and white-collar employees instantly see the productivity analysis on their dashboards.
Since all data is shared instantly over the cloud, you can follow it from your tablet, mobile or computer anywhere in the world.
- Which line works with how much productivity??
- How efficient is your department working?
- What is the % of productivity your entire factory working with?
You can change the location of the staff and vehicles whose efficiency you know very well when necessary.

Machine Learning & Artificial Intelligence
If you can count, you can collect data. If you have data you can collect constantly, you can analyze them as you wish. After the data have been successfully collected as described above, our expertise begins.
After a while, different needs will emerge. After a certain time, you will say;
“I would like to see how much stock moves where in how much time.”,
“I want to see which products are very active, which ones are less active.”.
The gigabytes of data flow including location information, product information, quantity of stocks, their movements, staff mobility, etc. occurs within a day. After our systems start to operate in the field, the data is collected in this way for 1 to 1.5 months. During this process, the software starts to learn your field thanks to these data from your site.
- -Who works how?
- Is a worker in your textile factory faster when joining the sleeve with the sleeve or joining the sleeve with the body?
- Whom to assign which machine?
- Which machines are suffering from how many failures?
- Where should this machine remain in the workflow during production, shipping or warehousing?, etc.
After the software starts to perform “machine learning” like this, you do not need to statically give some decisions.
For instance; you will say “I do not want to decide the layout of the shelf anymore, let the software tell it to me.”.

Firstly, the products which are mostly used in the field are identified. After this process, in a field where “machine learning” is conducted a stock layout which we do not understand when we look at it as humans starts to emerge. Because the machine begins to put the fastest moving to the front and the bottom, the slowest to the top of the back according to its learning.
Then the REAL time spent for this product is calculated. How much time is spent per product? Depending on it, the software starts to make plans for you with the “machine learning” and says;
“If you want efficiency, you need to carry this product here.”
Looking at the delivery list at the end of the day, the software is now able to plan how long it might take to collect the products in delivery.
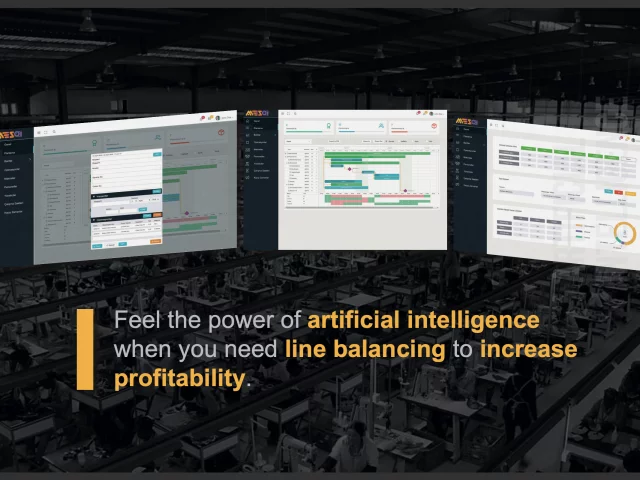
The system acquires the ability to perform line balancing after a while;
- – 1 million suits will be produced,
- – How long does it take to produce,
- – In which lines do I produce, how many people do I need to use,
- – In this critical period which productive staff should I employ.
Or
- How long does it take for the forklift to put pallets down from the shelf,
- Which shelf should I use in the stock area? How many minutes does it take? How many forklifts are necessary,
- How long does it take to bring them to the shipping area,
- How long does it take to load them on the truck,
- How long does it take to place tags during handling,
- How long does it take to move from the shipping area to the stock area,
- How many forklifts, how many people, how many minutes are used during these processes.
In the light of all these data, the system brings your costs to the actual unit costs.
Detection and Integration of Other Parameters into the system
Detection and Integration of Other Parameters into the system
The most important phase of Artificial Intelligence projects is to determine the relevant parameters that interest the firm and to load these parameters into the system. By re-evaluating the data under the light of these parameters, the software can lead you to vital changes within a short time in this regard.
The process without parameters:
If you do not give any parameters to the system, you can start using the data after a year. It will be limited to informing you about only the situation a year ago and will not be able to do an analysis. Only after 3 years, the machine will be able to understand something and conduct some analysis. In order for the machine to make a decision, it needs to go over the data twice. However, if the relevant parameters are loaded into the software, it can establish a healthy relationship between products and parameters. If the company says, “These are the parameters based on seasonal conditions, road conditions, and exchange rates in our production.”, the system starts to plan production, storage and shipment within itself even before that period. The parameters can be very different depending on the product range. Sample classical parameters are;

Seasonal Parameter:
Depending on the weather condition, the location of the product or production planning can be an important parameter. The company decides on which product to link with seasonal weather conditions. After a while the system will make the production plan or product positioning according to the seasonal conditions on its own.
Exchange Rate Parameter:
If the production and product shipment of the company vary depending on the dollar rate and if the movement of the products halts when the exchange rate increases, and it gets active when the rate decreases, the related parameters are entered into the system. According to the data to be received from the system, it plans the production and placement-shipment of the completed product.
Ad and Campaign Parameter:
It is a parameter if a product continuously enters inside in a period during which the campaign period begins. Stock arrival is monitored. If the entry of the product generally follows on a certain line, but if it has made an increase recently, this means a campaign period. It calculates the mobility and changes the shelf layout accordingly.
Service Packs:
Since all systems are located in the cloud, we are warned with a notification like “No signal from device X at location A” about possible failures in the components of the system. If there is a problem that cannot be fixed in the device, our technical services at 100 points located in 81 provinces nationwide and Turkish Republic of Northern Cyprus will respond immediately.
Your commercial data:
Commercial data is not collected from you. The system works only via UID. It queries these unique IDs from your system. It asks what to print regarding this barcode information on the operator’s screen. The system prints the comment you want it to display on the operator’s tablet as a comment line.
Warranty period of the devices:
The warranty period of the devices is 2 years. After 2 years, a maintenance contract is signed. The warranty period can be extended if desired.